Creating manless technology sets the goal – cyber-physical system development [1,2]. Such systems are based on the use of an intelligent mathematical tool and information technology in the field of decision-making in emergencies to ensure an acceptable assessment of the security level [3,4].
In such cases, situations often arise that require the use of special methods for solving non-routine problems [5,6].
Usually, to solve them it is necessary to conduct secondary analysis.
The presence of a weak structuring of architectural elements and a compound weave of interdependent connections lead to an uplevel of uncertainty [7,8].
Most often in such cases, artificial intelligence methods are used. The architecture of such systems implements the goals and objectives of monitoring industrial technology data [9,10].
The implementation of such architecture involves the use of a local network and an advanced system for monitoring the progress of the process. Based on this, the operator will exit the control loop of the process conditions and transfer the emergency management functions to the safety system.
The development direction of the automation system, that has a particular interest is the work of domestic scientists, for example [11,12], and foreign researchers [13-15].
This paper is intended to describe the principles of constructing the information monitoring system for industrial enterprise – the basics of creating manless technology.
Any modern industrial enterprise has a complex structure and regulations, therefore, for more effective management, material saving, and raw materials and to increase productivity, we should implement the monitoring systems.
Modern monitoring systems provide control and signaling of parameters of all equipment of technological systems and allow remote control of this equipment.
Systems for monitoring the technical condition of machines have become the most effective means of reducing costs during the transition to the maintenance of machines and equipment according to their actual condition. At the same time, savings on average according to statistics from developed countries make up about a third of the cost of repairs and maintenance.
The current generation of monitoring systems with an active diagnostic connection gives high results.
Firstly, due to the cost reduction of these systems using computer technology with a high-scale integration.
Secondly, due to the rapidly growing capabilities of the machinery and equipment computer diagnostics.
The problem set has a solution in several stages:
- problem definition,
- the monitoring technics development,
- necessary devices and software development
- observed data processing and evaluation
- the monitoring system final implementation in operation
This study develops a system design for monitoring production.
General principles for the information monitoring system development.
Monitoring systems provide control and signaling of parameters of all technology systems equipment and allow remote control of this equipment.
The modern monitoring and diagnostic system includes four components [16, 17]:
- signal measuring and analysis tools;
- monitoring tools;
- diagnostic tools;
- maintenance tools.
As a rule, a specialized company supplies such systems, rather than machinery and equipment manufacturers. These firms own monitoring and diagnostic techniques and produce the necessary technical means for these purposes.
Note that manufacturers often either cooperate with similar companies, fulfilling their requirements for the installation of measuring instruments, or gather machines with simple emergency protection means (protection monitoring tools), most often combined into one system with automatic control.
Often, specialized firms use techniques that contain different types of know-how, so the choice of a monitoring system usually begins with an assessment of their capabilities by the following indicators:
- detection completeness of abnormal situations,
- minimal time from defect detection to emergency,
- error probabilities in making responsible decisions,
- volumes and complexity of measurements and means for their implementation.
But no less important issues that are often lost on are the transition features from detecting an emergency to determining its type and degree of danger, that is, the transition from monitoring to diagnosis.
Since in practice each modern monitoring system has diagnostic system elements, it is these indicators that become decisive.
Monitoring has many aspects and it solves various problems depending on the system power and quality characteristics of the product produced by these systems.
Monitoring system's functions:
- the equipment technical specifications control (speed, pressure, electric voltage, etc.);
- equipment control (i.e. setting the desired values);
- control of managed technological characteristics;
- monitoring of environment parameters (measuring temperature and humidity);
- stop servers and start them on certain events, as well as on a pre-set schedule.
Dedicated and switched channels ensure the implementation of these functions by local computer networks and global communications networks, including mobile access via the Internet.
General requirements for monitoring systems
Monitoring systems, despite their diversity and specific properties, must fulfill the following basic requirements.
1. measurement parameters (including the external environment) must be performed at a frequency sufficient for an adequate representation of the system state.
2. systems should provide technical protection against unauthorized management (especially in the case of remote monitoring).
3. it is necessary to provide appropriate hardware and software for the monitoring system, in particular
a well-designed user interface.
4. The system must fulfill real-time requirements.
In addition, the customer, designer, and developer of the monitoring system can make their own requirements for the monitoring system.
Building a use case diagram
When designing a monitoring system, the developer must present possible system actions (transactions) in response to certain events initiated by some external object (actor).
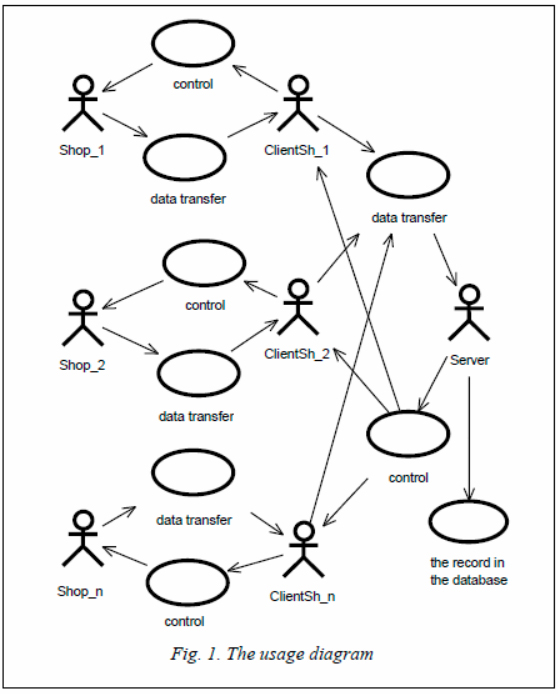 The usage diagram (fig.1) can help you do this. It is performed using the «Rational Rose» modeling tool for an abstract enterprise.
Figure 1 shows the options for using all the constituent parts of the designed system. The administrator manages the server, the server provides the necessary information. In turn, the server and clients (computers that receive the necessary information directly from the equipment of specific workshops) exchange the necessary data, and client administrators, if necessary, perform control actions on clients.
Simply put, information is collected on computers installed in workshops and transmitted (for example, through a local network) to a server, where it is written to the database.
For a more detailed analysis, it is necessary to store rather large amounts of information over a long period time. Next, the administrator or the system itself makes a decision on the implementation of a control action on a client and performs it. t should be noted that the name “client” is rather arbitrary, since the client is is such only concerning the server, and concerning its workshop it is a server itself.
Construction of a deployment diagram
Let's look at how the system will look at the physical level. Let's imagine a placement diagram that reflects the physical connections between the software and hardware components of the system and shows the placement of objects and components in a distributed system (Fig. 2).
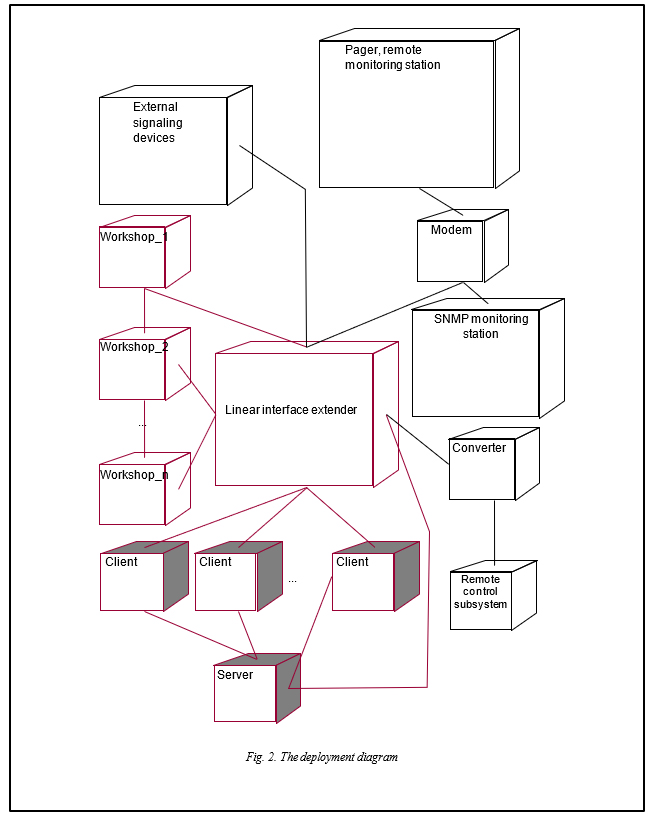 Elements depicted as transparent cubes are hardware components). In this case, this is the production line itself, which can consist of a different number of interconnected blocks (workshops), a line interface extender, a modem through which communication with a remote SNMP monitoring station or a monitoring station using paging communication, external signaling devices (devices intended directly for personnel working in the workshop).
Elements of the system, which are in the form of toned cubes, are software. In this case, the elements under the conditional name “client” are computers on which software is installed designed to manage and receive information from a specific production unit. The server provides information interaction between clients and monitoring.
The deployment diagram is less informative and does not quite reliably show the physical structure of the system. So, for example, in real conditions, there are several interface extenders, converters, or modems. In addition, it does not give a concept of how the various components of the monitoring system interact, how information flows during the interaction.
Construction of a state diagram
The next step in designing a monitoring system is to construct a state diagram. It defines all possible states that a particular object can be in, as well as the process of changing the object's state as a result of certain events.
In this case, there are two objects - the client and the server, although in reality there may be many clients. Figures 3 and 4 show the server and client state diagrams for an abstract enterprise.
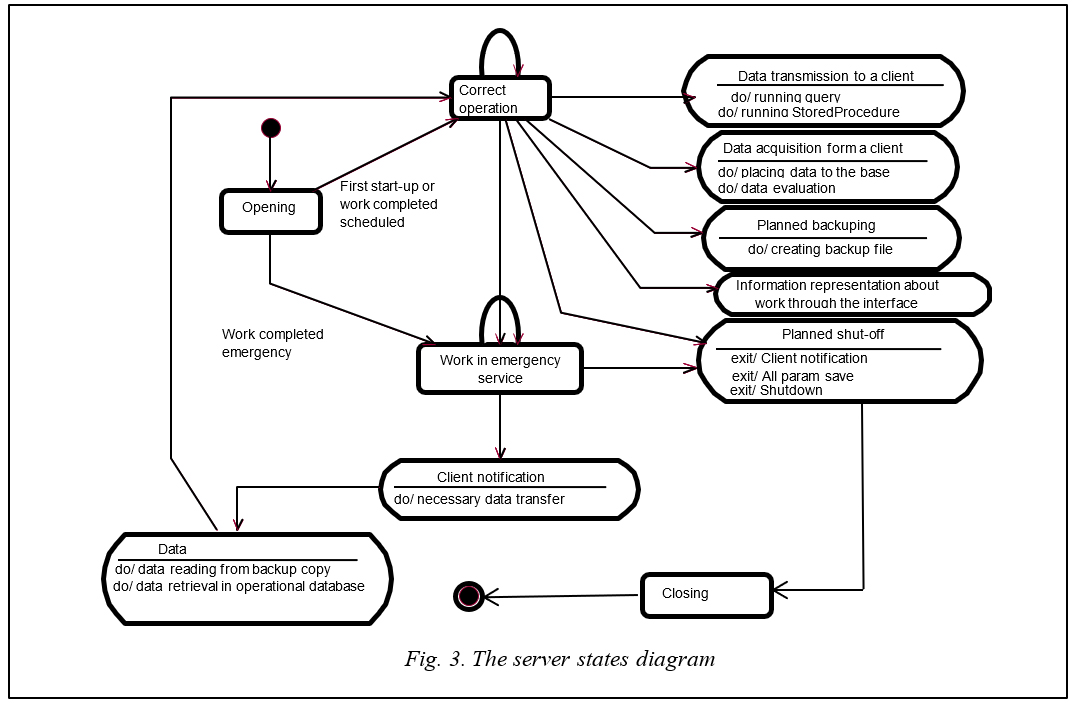
The diagrams show states and actions in specific states for the two main classes of the system - the server and clients. Ovals display the actions of objects, and rectangles display the states.
Let's take a closer look at the possible states for the server. Let's take a closer look at the possible States for the server. After opening, the server can switch to one of two states: normal operation or emergency operation mode.
In normal operation, the server can perform the following actions:
1. Data transmission to a client, which can occur either when receiving a request for any actions, or when performing a procedure stored on the server.
2. Data acquisition form a client: the server writes data to the database, then analyzes it, sends instructions to the client, and performs a scheduled backup. Copying is performed using DBMS tools according to a schedule formed by the administrator in advance.
3. Information representation about work through the interface
4. All clients notification, all param save and shutdown at a scheduled stop.
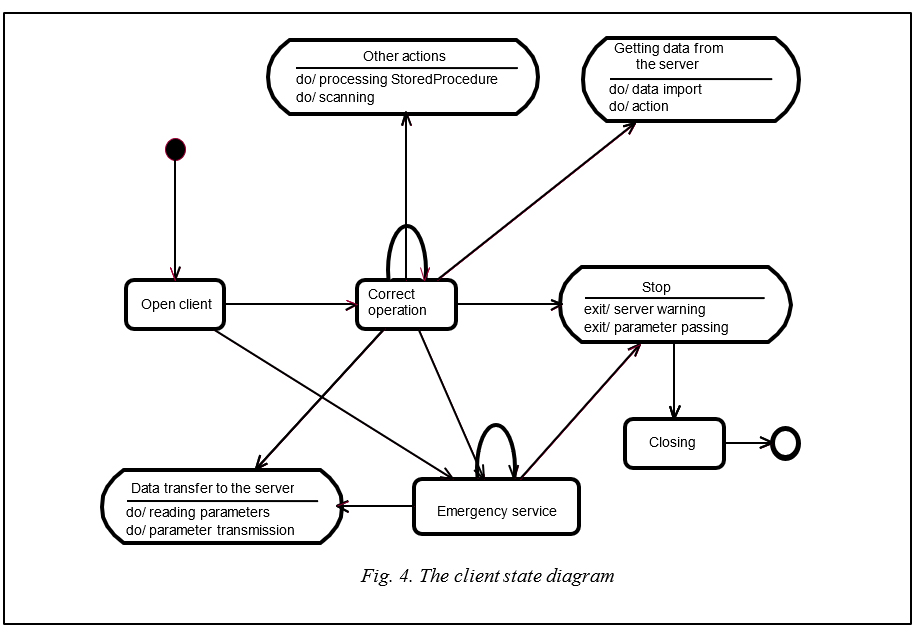
In relation to the monitoring system under consideration, the client has a smaller number of actions performed in various states, but the number of states themselves (opening, working in normal mode, working in emergency mode, and closing) does not change. After switching to the emergency operation state, after switching on, or after an unexpected event occurs, the client passes all the appropriate information to the server, then receives instructions from it to either disconnect or switch to the normal operation state. During correct operation, the client exchanges the appropriate information with the server, and in certain circumstances it may be scheduled to disconnect after giving warning the server.
In the correct state of operation, the client performs so-called other actions that are not directly related to the monitoring system (managing their department and removing parameters from counters).
The construction of information model
The main stage of the construction of information model is to determine the classes that it will consist of. This is done using a diagram that defines the types of system classes and various static connections between them (Fig. 5). The diagram shows the attributes of classes, their operations, and restrictions that apply to connections between classes.
 Let's present the main types of classes in the system.
1. An external environment with parameters such as raw materials, density, humidity, etc. Knowing these parameters is necessary for the proper operation of any monitoring system of any industrial enterprise.
2. A set of classes that directly define the shop (departments) of the enterprise. Depending on the type
of production, these classes may have a different number of various attributes.
3. Smaller subclasses of the class of each workshop of the enterprise, which directly implements the equipment of the production line of this workshop.
The main class of the system is the server, which collects the values of all the necessary parameters of the shops, provides control actions, and works with the database.
The class diagram also reflects the flow of information between the server and the clients. For example, the server receives information from the external environment containing the characteristics of the raw materials and information on the available quantity of these raw materials, while the server, in turn, transfers information on the number of raw materials that can be processed, for example, the first workshop (this the server receives information from the client TShop_1). Similarly, information flows between the server and other clients.
The component's diagram construction
Component’s diagrams show how the model looks at the physical level (Fig. 6).
 This type of diagram is for the distribution of classes and objects by components during the physical design of the system. Often they are called module diagrams.
When designing large systems, when the monitoring system must be decomposed into several hundred or even thousands of components, this type of diagram allows you not to get lost in the abundance of modules and their connections.
The main essence of the clients ' functioning is:
1. The client collects information.
2. Passes it to the server.
3. Receives the necessary control information from the server.
4. Follow directions.
5. Then you proceed to point 1.
Basic software requirements for the designed
monitoring system
At any complex production facility, there are strict requirements for monitoring system software. Sometimes even a minor failure or delay in operation can lead to the collapse of the entire system in all, which is one of the specific features of complex technological schemes.
Therefore, there are a number of mandatory requirements for the operation of software monitoring systems for industrial enterprises.
1. Real-time requirement: you must take into account the time of the maximum possible delay when transmitting data from the client to the server and inversely because even a time trivial loss can lead to the system incorrect reaction to events (for example, there are no problems or failures in the system at this time). Accordingly, the "client" sends the required data indicating this to the server. Let's assume that the data arrives late. The server reacts to them accordingly and sends some control information to the client, which in turn will no longer be relevant for the client, since its state may have changed significantly by this time.
2. Required reading frequency: parameters must be transmitted from the client to the server with a frequency proportional to the frequency of fundamental changes in system states. The more often the system changes its state, the more often you need to send information about it. If the system state does not change, the information does not need to be transmitted, and the load on the network decreases.
3. The requirements for data integrity. The network Protocol is responsible for the data integrity, but in the case of an enterprise monitoring system, it is better to use more of a risk but a faster protocol that meets real-time requirements.
4. Requirements for the information capacity: it is wise to provide a procedure for deleting old information from memory.
5. The hardware requirements: it should be without special problems to maintain the correct operation of the system.
6. Requirements for the software interface: as simple, clear,
7. and informative as possible.
These requirements are required for any monitoring system software.
Implementation of industrial enterprise monitoring system software.
In the case of a designed system, the specialist who will implement this implementation must choose how to implement the software.
Usually, such systems are constructed on the basis of a three-level DB-application architecture, in particular, on the basis of support for the Multi-Tier Distributed Application Services (MIDAS) technology implemented in the C++Builder environment. In this case, there are the following components.
1. A database server that is hosted on one computer. You can use any DBMS, Inter, Interbase, Oracle,
MS SQL Server.
If you construct the enterprise monitoring software, we recommend using MS SQL Server. It has a wide range of tools for creating stored procedures and triggers, for database backup, and for symmetric multiprocessing (SQL Server 2000 Enterprise Edition running Windows 2000 Datacenter). In addition, SQL Server has such most important features as network independence, i.e. it can work with TCP/IP, IPX/SPX, Named Pipes, Apple Talk, and Banyan Vines protocols.
2. Application server on the second computer. It contains tools for supporting business rules and data manipulation.
3. A client application with limited resources on the third computer. This application performs functions related to presenting data to the end-user.
Unlike the database server, the application server and client application are implemented in C++ Builder or Delphi.
A departure from the classic version is the system layout, which involves combining both the database server and the application server on the same computer. However, since each of the components is created as unganged, the architecture of the entire system has three levels. You can also combine the application server and client in the same program, i.e. provide direct access to the DBMS.
In conclusion, it should be noted that the Rational Rose environment (in which the monitoring system for an abstract enterprise was designed in this paper) allows you to create a monitoring system model for a specific production with specific parameters and rules of operation and then generate a ready-made program code that can be used.
Acknowledgements : The work was supported by RFBR grant (project no. 20-07-00914).
References
1. Lipkin E. Industry 4.0: Smart Technologies a Key Element in Industrial Competition. Moscow, 2018.
224 p. (in Russ.).
2. Schwab K., Davis N. Shaping the Fourth Industrial Revolution. World Economic Forum Publ., 2018,
287 p. (Russ. ed.: Moscow, 2018, 320 p.)
3. Roth A. Einfuhrung und Umsetzung von Industrie 4.0. Grundlagen, Vorgehensmodell und Use Cases aus der Praxis . Berlin, 2016, 272 р. (in Germ.).
4. Voitovich I.D., Korsunsky V.M. Intelligent Sensors. Moscow, 2016 (in Russ.).
5. Melikhov A.N., Bernstein L.S., Korovin S.Ya. Situational Advisory Systems with Fuzzy Logic. Moscow, 1990, 271 p. (in Russ.).
6. Palyukh B.V., Bogatikov V.N., Prorokov A.E., Alekseev V.V. Applying the State Separation Method
to Control Industrial Process Safety Based on Fuzzy Defined Models . Tver, 2009, 368 p. (in Russ).
7. Vinogradov G.P., Bogatikov V.N., Kuznetsov V.N. Fuzzy linear programming problems in motivated systems.Bull. of the Astrakhan State Tech. Univ.: Management, Computer Sciences and Informatics. 2019, no. 4, рр. 131–140 (in Russ.).
8. Yakhyaeva G.E. Fuzzy Sets and Neural Networks. Moscow-Saratov, 2014, 320 p. (in Russ.).
9. Gvozdeva T.B., Ballod B.A. Design of Information Systems. Rostov-on-Don, 2009, 508 p. (in Russ.).
10. Evgenev G.B. Intelligent Design Systems Textbook. Moscow, 2009, 334 p. (in Russ.).
11. Veremey E.I. Management with Predictive Models. St. Petersburg, 2014, 212 p. (in Russ.).
12. Pristupa M.Yu., Smagin V.I. Model predictive control of the output time-verying discrete system with constraints on the control. Tomsk State Univ. J. Control and Comp. Sci., 2013, no. 3, pp. 14–23 (in Russ.).
13. Prasath G., Jorgensen J.B. Model predictive control based on finite impulse response models. Proc. ACC, IEEE, 2008, pp. 441–446.
14. Bemporad A., Morari M., Ricker N.L. Model Predictive Control Toolbox: Getting Started Guide. 2015, 166 p.
15. Maciejowski J.M. Predictive Control with Constraints. Prentice Hall Publ., 2002, 331 p.
УДК 66:519.7
DOI: 10.15827/2311-6749.20.2.3
Проектирование информационной системы мониторинга промышленных предприятий
П.М. Мурашев 1 , аспирант кафедры информационных систем, myptver@gmail.ru
Т.О. Бочкарева 1 , аспирант кафедры информационных систем, 3142713283@rambler.ru
И.Е. Кириллов 2 , к.т.н., доцент кафедры физики, биологии и инженерных технологий, kirillovi@rambler.ru
В.Н. Богатиков 1 , д.т.н., профессор кафедры информационных систем, VNBGTK@mail.ru
В.В. Кушнаренко 3 , начальник отдела прогнозирования и моделирования развития сети связи, vvk@an-net.ru
1 Тверской государственный технический университет, г. Тверь, 170023, Россия
2 Филиал Мурманского арктического государственного университета, г. Апатиты, 184209, Россия
3 Компания Тверские информационные технологии, г. Тверь, 170024, Россия
Автоматизированное обслуживание систем управления и оборудования по их фактическому состоянию является актуальным направлением исследований. Реализация подобных разработок на предприятиях позволяет снизить затраты на профилактическое обслуживание, а также обеспечить раннее предупреждение возможных внезапных отказов. Ключевая роль в решении данной задачи отводится контролю за техническим состоянием технологий, машин, оборудования. Это предполагает создание принципиально новых подходов к построению мониторинговой системы оценки состояний и управления промышленными объектами. В частности, показывает свою эффективность применение методов искусственного интеллекта.
В работе обобщено описание принципов построения информационной системы мониторинга по контролю технического состояния машин и оборудования промышленного предприятия. Обоснованы общие требования к системам мониторинга. Построены диаграммы вариантов использования, а именно: диаграммы размещения, диаграммы состояний, диаграммы информационной модели и диаграммы компонентов.
Определены основные требования к программному обеспечению спроектированной системы мониторинга. Выполнена реализация программного обеспечения системы мониторинга для абстрактного промышленного предприятия.
Ключевые слова: информационная система мониторинга, промышленное предприятие, техническое состояние машин и оборудования, информационная модель, программное обеспечение.
Благодарности. Работа поддержана грантом РФФИ (проект № 20-07-00914).
Литература
1. Липкин Е. Индустрия 4.0: Умные технологии — ключевой элемент в промышленной конкуренции. М.: Остек-СМТ, 2018. 224 с.
2. Шваб К., Дэвис Н. Технологии четвертой промышленной революции; [пер. с англ.]. М.: Эксмо, 2018. 320 с.
3. Рот А. Внедрение и развитие Индустрии 4.0. Основы, моделирование и примеры из практики; [пер. с нем.]. М.: Техносфера, 2017. 294 с.
4. Войтович И.Д., Корсунский В.М. Интеллектуальные сенсоры. М.: ИНТУИТ-Бином. Лаборатория знаний. 2009. 824 с.
5. Мелихов А.Н., Бернштейн Л.С., Коровин С.Я. Ситуационные советующие системы с нечеткой логикой. М.: Наука, 1990. 272 с.
6. Палюх Б.В., Богатиков В.Н., Пророков А.Е., Алексеев В.В. Приложение метода разделения состояний для управления технологической безопасностью промышленных процессов на основе нечетко определенных моделей. Тверь: Изд-во ТГТУ, 2009. 368 с.
7. Виноградов Г.П., Богатиков В.Н., Кузнецов В.Н. Задачи возможностной оптимизации в мотивированных системах // Вестн. Астраханского гос. технич. ун-та. Управление, вычисл. техн., информ. 2019. № 4. С. 131–140.
8. Яхъяева Г.Э. Нечеткие множества и нейронные сети. М.-Саратов, 2017. 320 c.
9. Гвоздева T.B., Баллод Б.А. Проектирование информационных систем. Ростов н/Д.: Феникс, 2009. 508 с.
10. Евгенев Г.Б. Интеллектуальные системы проектирования. М.: Изд-во МГТУ им. Н.Э. Баумана, 2009. 334 с.
11. Веремей Е.И. Управление с прогнозирующими моделями. СПб: Изд-во СПбГУ, 2014. 212 с.
12. Приступа М.Ю., Смагин В.И. Прогнозирующее управление выходом нестационарной дискретной системы при ограничениях на управление // Вестн. Томского гос. ун-та. Управление, вычислительная техника и информатика. 2013. № 3. С. 14–23.
13. Prasath G., Jorgensen J.B. Model predictive control based on finite impulse response models.
Proc. ACC, IEEE, 2008, pp. 441–446.
14. Bemporad A., Morari M., Ricker N.L. Model Predictive Control Toolbox: Getting Started Guide.
2015, 166 p.
15. Maciejowski J.M. Predictive Control with Constraints. Prentice Hall Publ., 2002, 331 p.
Комментарии